
Your Marketing Report Is Missing Revenue. Here’s How to Track It.

Most marketing reports highlight impressions, followers, brand awareness, and clicks, and while these metrics are important in the big picture, it’s difficult to see how they tie to revenue. What your CEO really wants to see is how marketing contributed to the bottom line. With the right infrastructure in place, you can set up your tracking to directly outline marketing’s contribution to revenue.
This article walks you through how to prioritize the metrics that matter, how to rebuild your next report around those metrics, and how to present it to a CEO so you can report marketing’s impact on revenue and increase marketing’s credibility in the process.
Before you can successfully add revenue to your marketing report, you have to understand what metrics you’re tracking. We’ve broken important metrics into four tiers.
Quick Note on Buyer Behavior
People’s behavior isn’t always linear. A prospect might encounter your brand once, forget about you, then convert months down the line when they see a billboard for your product or service. This winding path inevitably makes tracking revenue nuanced. But, if you set up your tools correctly and have the right parameters in place, you should be able to trace around 80% of revenue easily.
Four Tiers to Rank Marketing Metrics
Bigger numbers don’t necessarily equal better metrics.
Just because you have millions of impressions, doesn’t mean that’s the most valuable metric to highlight in your report. The metrics that matter, like qualified leads, might be less interesting, but a bigger impact when showing how marketing moved the bottom line.
Instead of starting with the biggest (or most impressive) numbers and working your way down, start with the most valuable number you can measure, then work down toward clicks or impressions.
Here are four tiers to use next time you’re gathering data for a quarterly report.
Tier 1: Metrics That Show Revenue and Return
Marketing ROI is the gold standard. The more of it you can measure directly, the easier your budget conversations get.
The other tier one metrics are cost per opportunity, customer acquisition cost (CAC), and return on ad spend (ROAS). Say you spent $20,000 on paid campaigns in a quarter and got 10 opportunities. Your cost per opportunity is $2,000, and a CEO can compare that to average deal size right away.
These metrics make the case for more marketing budget because they’re in dollars, which finance and sales already follow closely.
Tier 2: Metrics That Track Qualified Leads and Predict Pipeline
The second tier is leading indicators. These are the numbers that point toward and predict pipeline.
- Cost per lead, cost per marketing qualified lead (MQL), and cost per sales qualified lead (SQL)
- Lead-to-opportunity ratio
- Conversion rate from form submission to qualified lead
- Demo or meeting request volume
- Lead quality by source
Be careful with raw lead counts. If a lot of your leads are spam or poor fits, a higher lead count doesn’t help sales, and they’ll stop putting weight on it. Qualified leads are the number to watch in this tier. If marketing and sales don’t agree on what “qualified” means yet, sort that out before you report on it. Our guide to common CRM problems covers MQL and SQL definitions in Problem #4.
Tier 3: Metrics That Show Whether the Right Audience Is Growing
Tier three metrics don’t tie to revenue directly, but they show whether the right people are finding you and paying attention.
Here are the most useful tier 3 metrics to track:
- Qualified site traffic, meaning visitors from the sources your ideal customers use who read and click through your pages
- Branded search growth, or more people searching for your company by name
- AI search visibility, or whether Claude and other AI tools cite you in their answers
- Time on site and scroll depth
- Share of voice
When looking through tier 3 metrics, make sure you’re prioritizing qualified traffic. Can you tell if traffic is coming from credible sources? Are they engaging with your website in a way that demonstrates buyer behavior and not bot behavior?
Visitors from companies in your target market reading your pricing and service pages can tell you a lot about audience growth and next quarter’s pipeline.
Tier 4: Metrics That Measure Reach
And lastly, there are the metrics that measure reach. This is where you can track social media followers, impressions, and total site visits. While these metrics can’t say whether your followers or site visitors are your eventual buyers, they do communicate general brand awareness, which is important in determining scale.
Tier four metrics should be at the bottom of your report labeled as “reach”.
Problems With Tracking? It Might Be Your CRM Setup
Before you can report on revenue, your CRM has to capture it. There are three things you’ll need to do to make sure your tracking is solid.
- Give each deal stage in HubSpot a value.
- Find any revenue metrics you can’t measure yet, and why.
- Set up a dashboard to track revenue week to week.
We dive into each step below.
Step 1: Review Deal Stages in Your CRM
Start by reviewing your deal stages in HubSpot and giving each stage a value, so you can see what your pipeline is worth before deals close. For example, say a closed won deal is worth $10,000, if 30% of deals close, then each deal is worth $3,000. And if 50% of MQLs turn into deals, each MQL is worth $1,500.
Step 2: Note Any Missing Metrics
Next, look at any tier one metrics you aren’t able to measure and write down what’s missing. It will usually come down to a tracking issue in the CRM, and the good news is that these issues are common and solvable.
It could be that your ad platforms aren’t receiving qualified leads as conversion events, your UTMs aren’t making it into your CRM, or that deals are getting created without a lead source. We walk through how to solve each of these in our guide, The CRM Problems We See Most Often, and How to Fix Them.
Step 3: Set Up Your Dashboard
Once your CRM is capturing revenue, set up a dashboard to view it, so you can track revenue week to week and pull the numbers for your next report. Since your data already lives in your CRM, that’s the easiest place to build it. We’ll walk through an example using HubSpot.
To create a dashboard, go to Reporting > Dashboards, click Create dashboard, and either start from one of HubSpot’s templates or a blank dashboard. Then add your reports by clicking ‘Add Content’ and selecting ‘Report’. From there, you can filter each report by date range, owner, or pipeline so it only shows what you need. Learn more in HubSpot’s guide to creating dashboards.
Here’s a list of reports we add to get started.
- Revenue by month, broken down by company or lead source
- Deals created over time, with the previous year for comparison
- Pipeline against your goal
- Close rate and average deal value, with the percentage change from last period
When we build dashboards for clients, we look for three things.
#1: Does it tell a story at a glance?
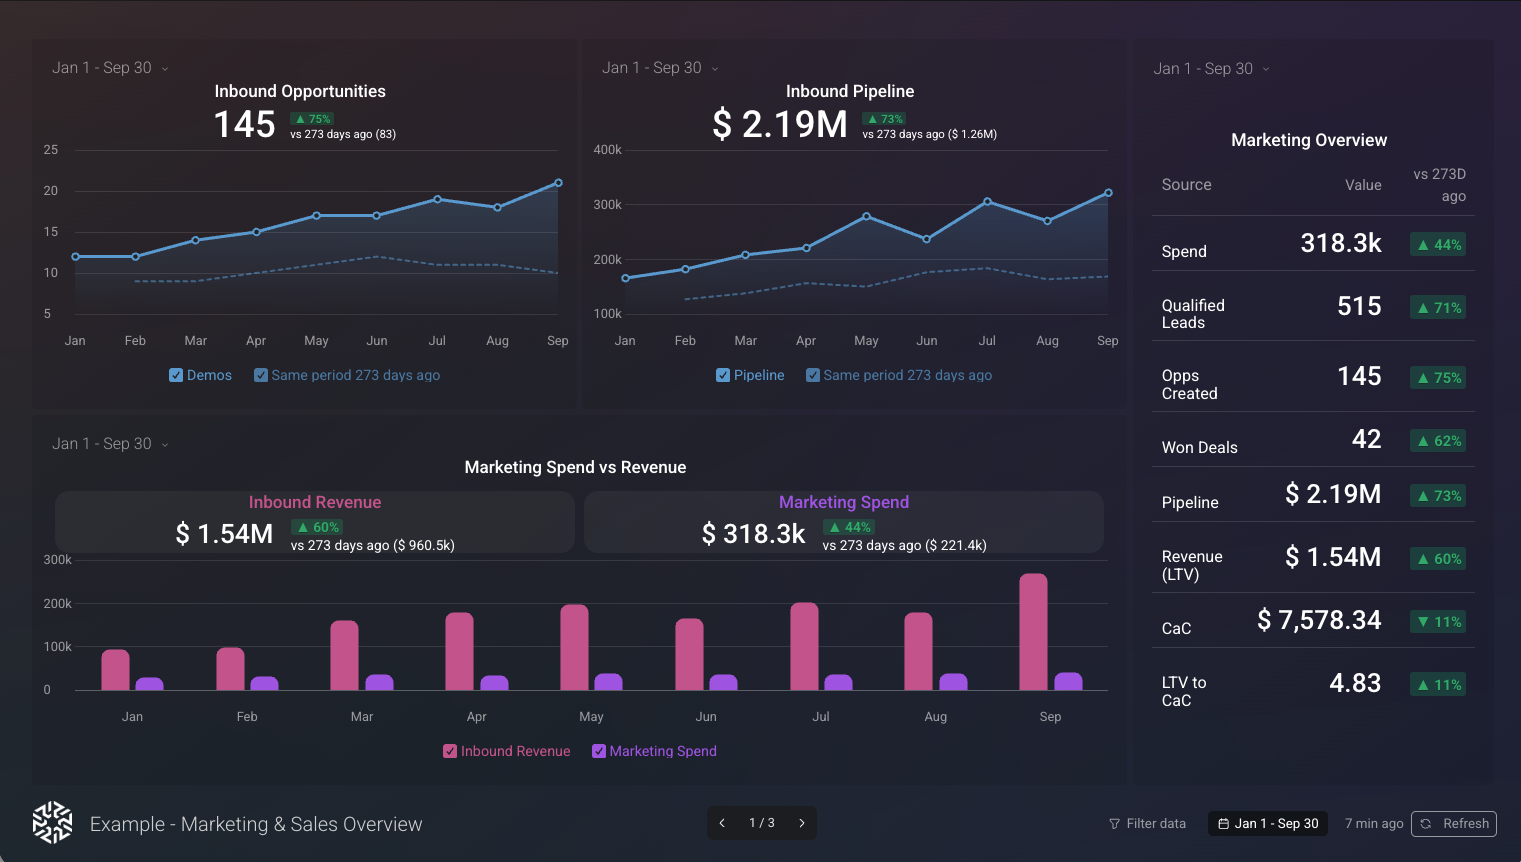
In a few seconds, you should be able to tell how you’re doing. A big spike in revenue means a strong month, and a metric showing up in red, like a dip in close rate, tells you what needs attention.
#2: Does it tell a deeper story when you look closer?
In other words, can you break revenue down by company and see which deals are driving each month? For example, one of our clients had a strong month where one $1.9 million deal made up 60% of their revenue. Having a dashboard that tells the complete story helps differentiate between steady growth and one big deal.
#3: Does it give your other numbers context?
Put this year next to last year, or add the percentage change beside each metric, so anyone looking can tell whether a number is good or bad.
Here’s an example of what a great dashboard looks like:
And if you’re overwhelmed by the data or not sure where to start, let’s chat about how to set your dashboards up for success!
How to Build an Effective Marketing Report Around Revenue
Now that you’ve organized your metrics into their respective tiers, it’s time to build a marketing report that showcases these effectively.
Start by putting the revenue at the top of the report in order of tiers. Notate tiers three and four as “directional indicators”. For each directional metric, include a note about how it helps predict pipeline growth. For example, if branded search grew by 30%, and you know your branded visitors have a higher demo request rate than non-branded visitors, you can calculate an increase in demos coming down the line.
After walking through the percentage of revenue that your team brought in, spend some time reviewing directional metrics. Revenue-centric numbers get you the short-term buy-in, but directional metrics help build longer-term buy-in with your team, which is what keeps budget available for brand awareness and other work that takes longer to turn into pipeline.
Marketing Metrics FAQs
If you’re working on your next report and still have questions, here are answers to a few we hear often.
Should We Stop Tracking Impressions and Followers?
Definitely not. Impressions and followers demonstrate growth in brand awareness and reach, which is important for determining scale. Use these metrics to explain the cause-effect relationship of your revenue-centric metrics. Just be sure to showcase the revenue numbers first.
How Do I Start Tracking Marketing ROI?
Connect your ad platforms to your CRM, capture UTMs on every form, copy the lead source onto every new deal, and send qualified leads back to your ad platforms as conversion events.
What Are Vanity Metrics in Marketing?
Vanity metrics, like impressions, followers, and total site visits, are numbers that are easier to grow and report on, but harder to connect to revenue. While still useful as a measure of reach, they become a problem when they’re the only metric your CEO or board sees.
What’s the Difference Between a Lead and a Qualified Lead?
A lead is anyone who fills out a form or otherwise shares their contact information. A qualified lead is a real person who fits your target customer profile and has shown interest. Raw lead counts can include spam and poor fits, so qualified leads are a much better predictor of pipeline.
Conclusion and Next Steps for Revenue-First Reporting
Filling the revenue-shaped hole in your marketing report starts with the right setup. Once your tracking is in place, you can show how the marketing team moved the bottom line, and build the case for more budget down the road.
And if you’re still stuck on tracking, reach out and we’ll set up a free tracking audit with one of our specialists.
